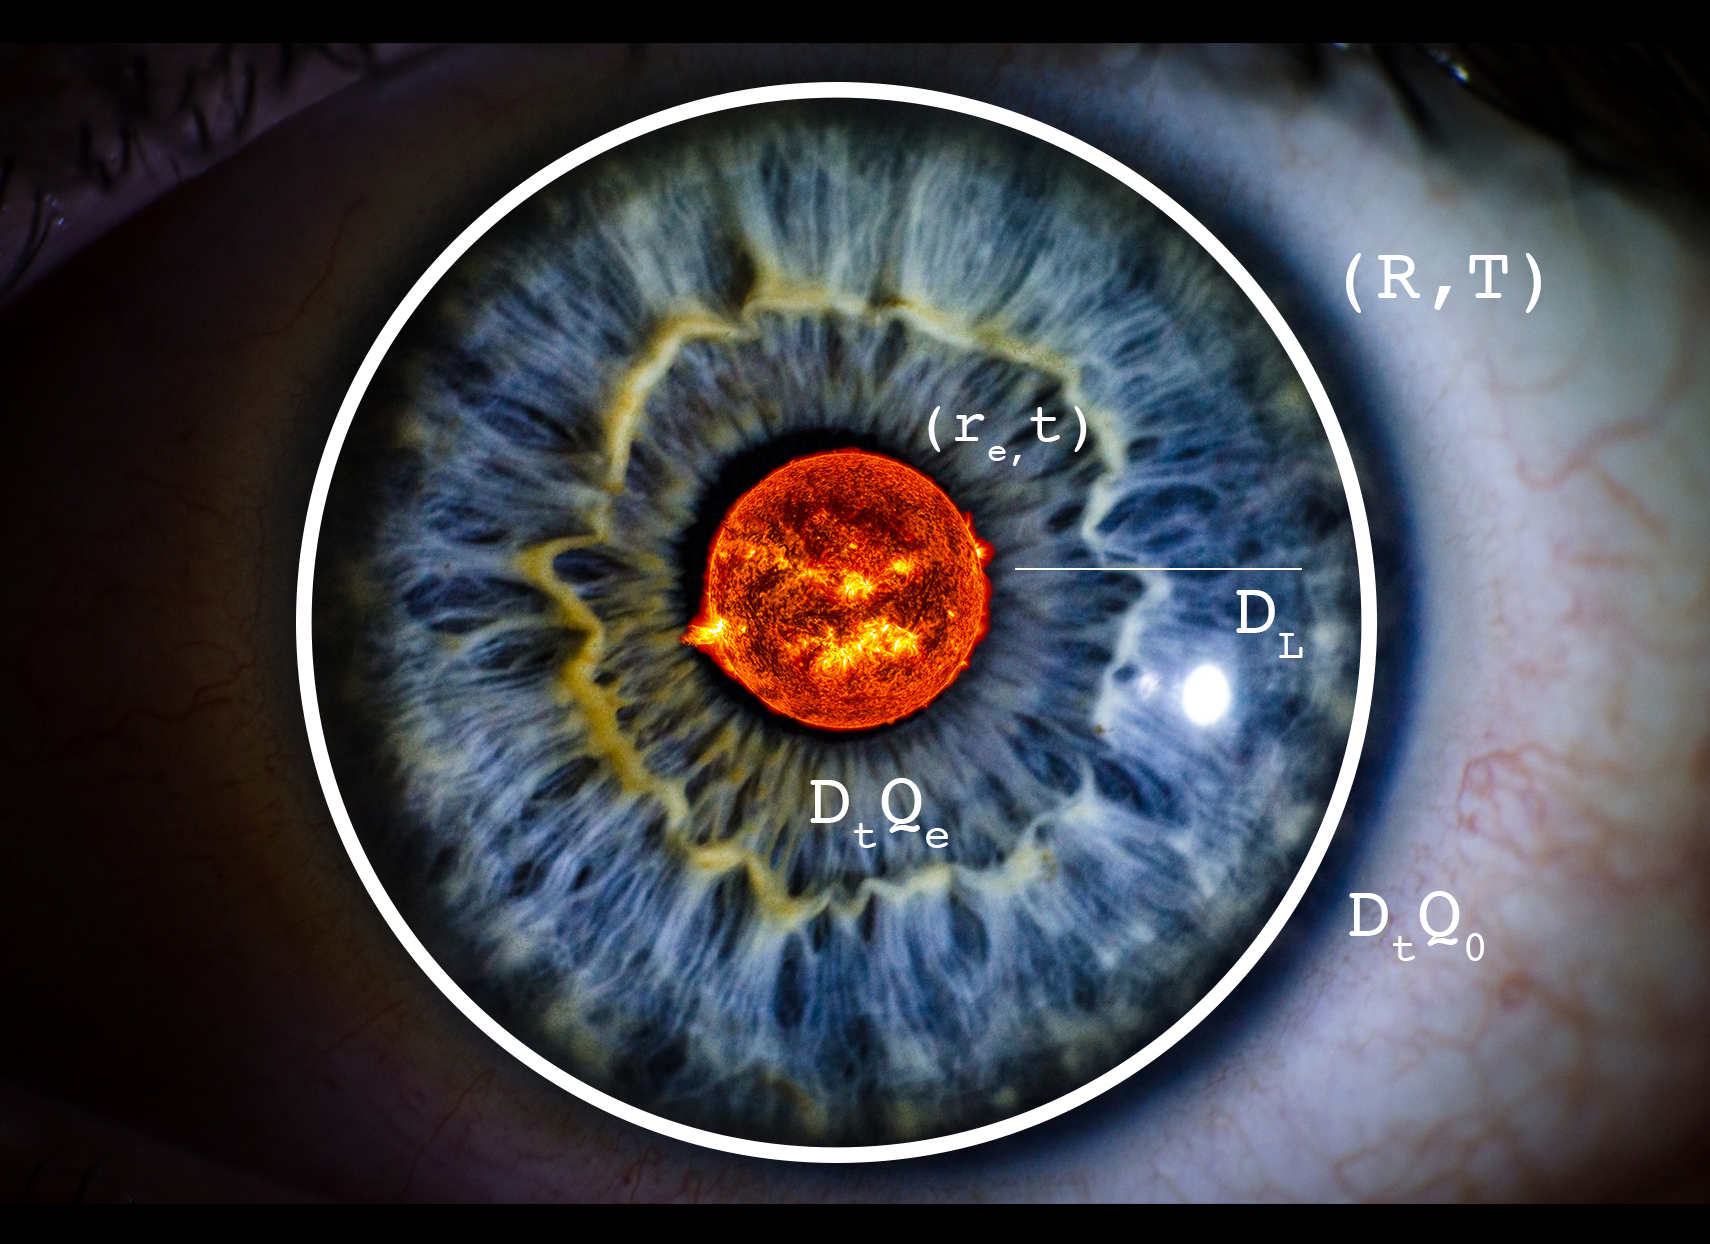
THE EYE OF THE SUPERNOVA
PROJECT BRIEF: Measuring the Immeasurable
Choose a scientific or rational form of representation such as a weather map and hurricane visualizations, radiation map or heat map, molecular rendering, thermodynamic surface models, supernova explosion diagrams, Florence Nightingale’s Coxcombs, John Snow’s dot map or other site plans, PET scans, topographical maps, star formation visualization, gravitational wave visualization, scatter plot 3D diagrams, NASTRAN models, Network Analysis, Stream Graphs, Tree-maps, Gantt charts, stripe graphic, etc.
Now augment or create your own drawing based on the above notation BUT use it to show intangible phenomena such as an IDEA, and EMOTION, or EVENT. You may use annotation as part of the drawing but please stick as close as possible to your scientific notation precedent.